
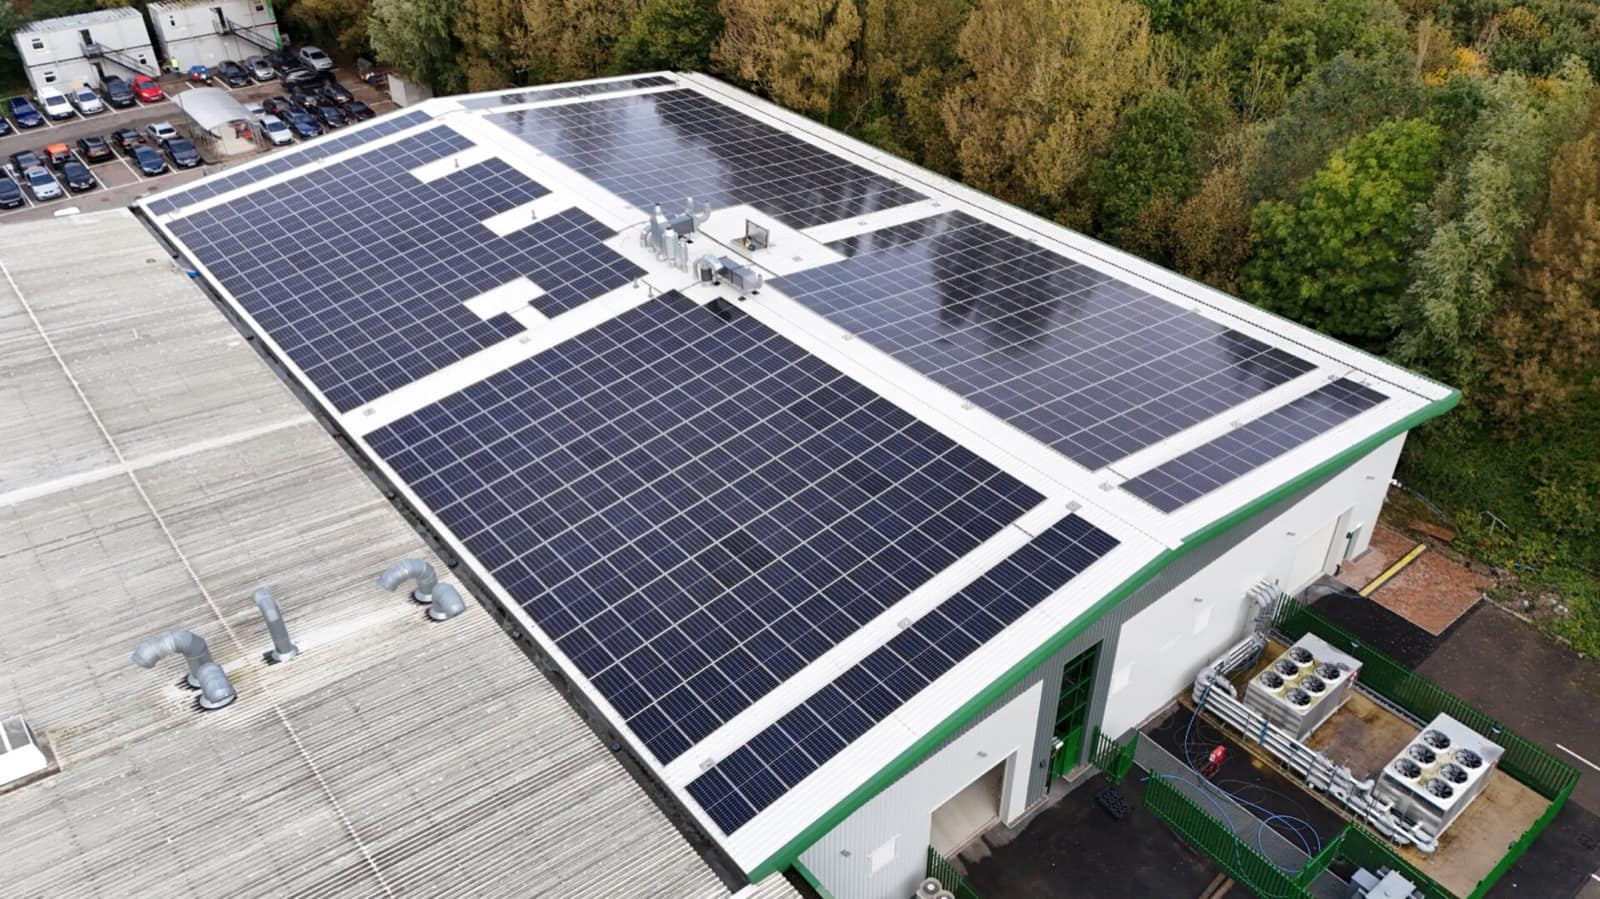
Sized to your shift pattern. Not your roof space.
UK manufacturers pay 89% more for electricity than the EU14 median for medium industrial users (H2 2024) — and sizing solar to last year's bill misses how production demand actually behaves.
Commercial solar, storage and grid infrastructure engineered around your real half-hourly demand — built for the Operations, Finance and Sustainability leads running energy-intensive sites.









What the numbers say about manufacturing right now.
In H2 2024, UK industrial electricity prices for medium users were 89.3% above the EU14 median — the highest in the comparator group.
Source: DESNZ, International Industrial Energy Prices, Table 5.4.1
UK non-domestic electricity prices rose over 90% (Q1 2021→Q4 2023) and remained 75% above Q1 2021 by Q4 2024; real output of energy-intensive manufacturing fell 33.6% over the period — its lowest since the series began in 1990.
Source: ONS, The impact of higher energy costs on UK businesses: 2021–2024
Among industrial businesses that have experienced grid connection delays, 34% say it has stopped growth altogether, and 25% are considering locating new plants overseas.
Fewer than 5% of UK commercial and industrial rooftops currently carry solar.
Source: Solar Energy UK
Figures are third-party sourced and current at time of publication. Each links to its original source above.
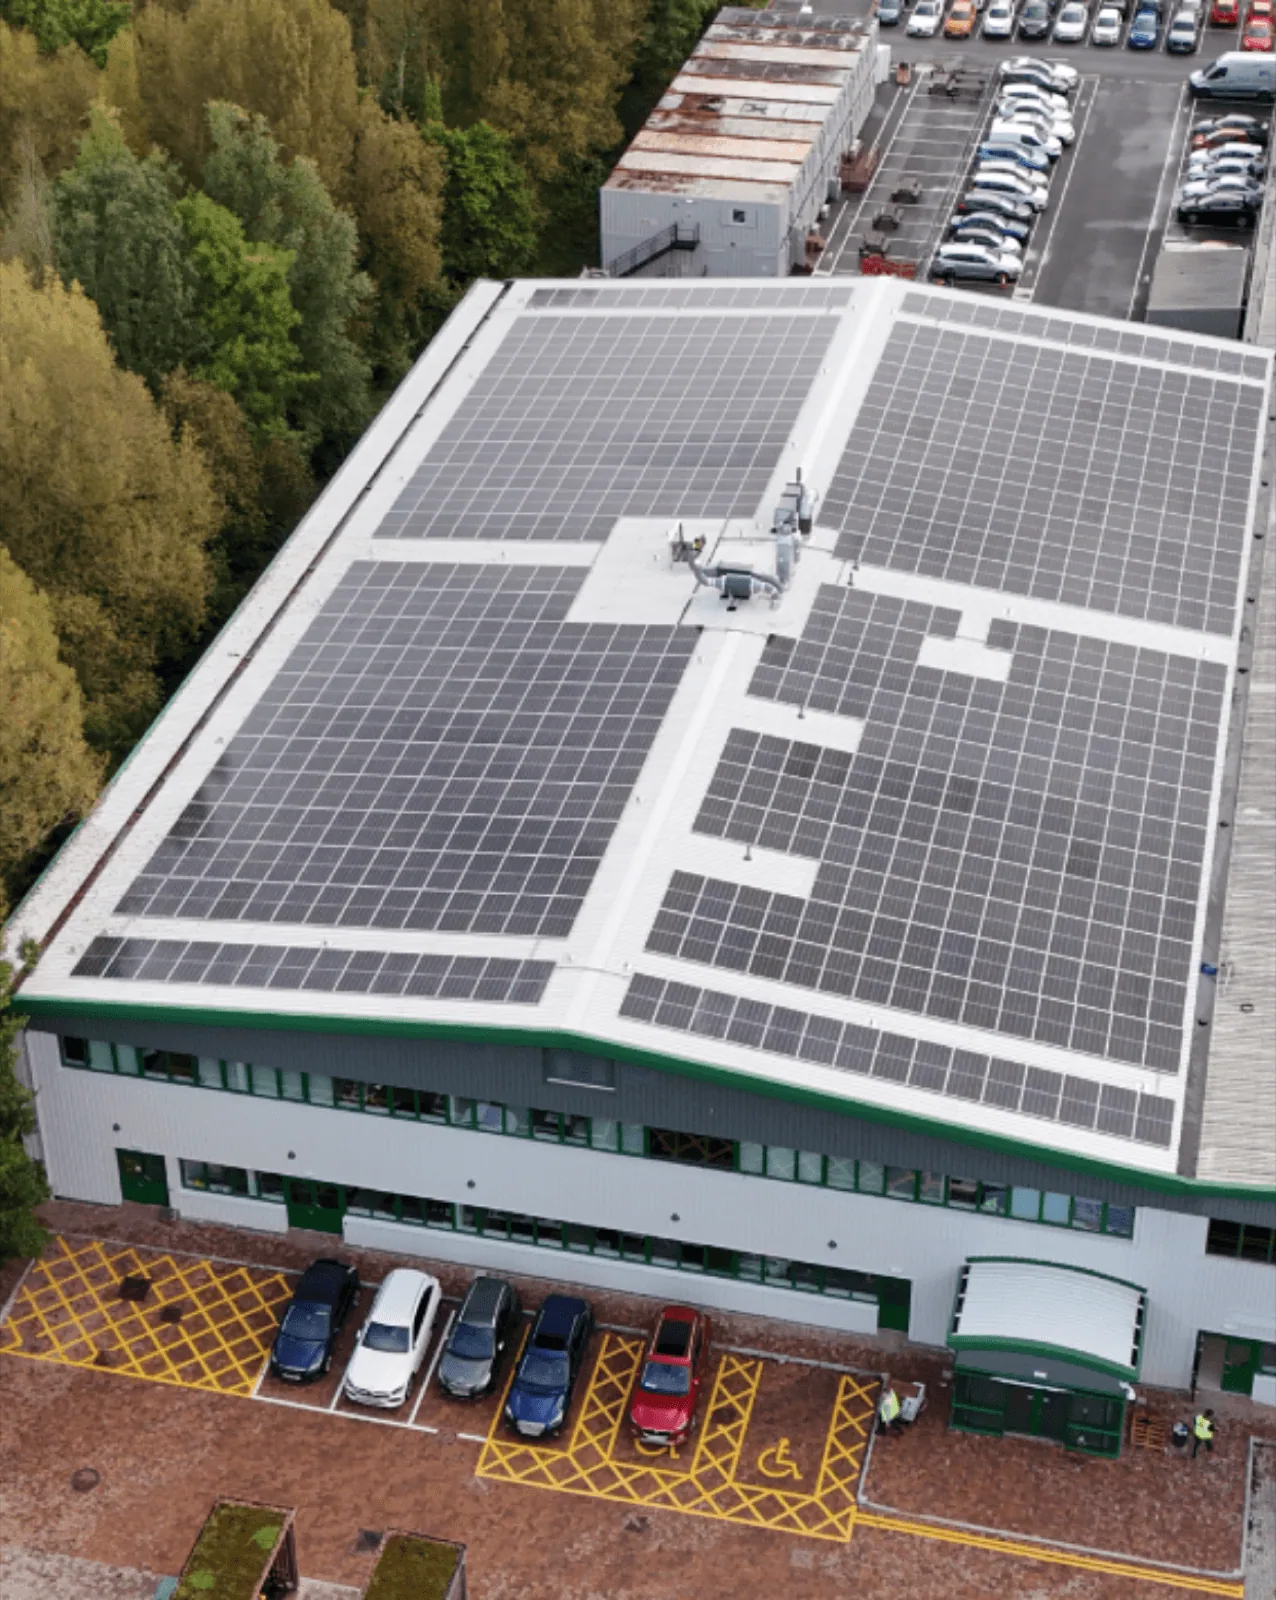
In this sector's language.
The pressures a manufacturing team actually voices — not the ones a brochure assumes.
"Our energy cost is no longer forecastable"
Volatile unit rates are eating into margin on a site that can't reduce consumption without cutting output.
"Our grid connection is capping our expansion"
A new production line or automation upgrade is blocked by DNO capacity, not capital.
"We've had three quotes — none of them join up"
One wants to sell panels, one wants to sell batteries, and none of them will take responsibility for the whole system once it's live.
"We can't take downtime to find out if this works"
A 24/7 or multi-shift site can't absorb a disruptive installation or an underperforming system.
Where does your site actually sit?
Five quick questions. No form, no number to chase — a directional read on your real constraint, and the fastest route in.
Which of these sounds most like you?
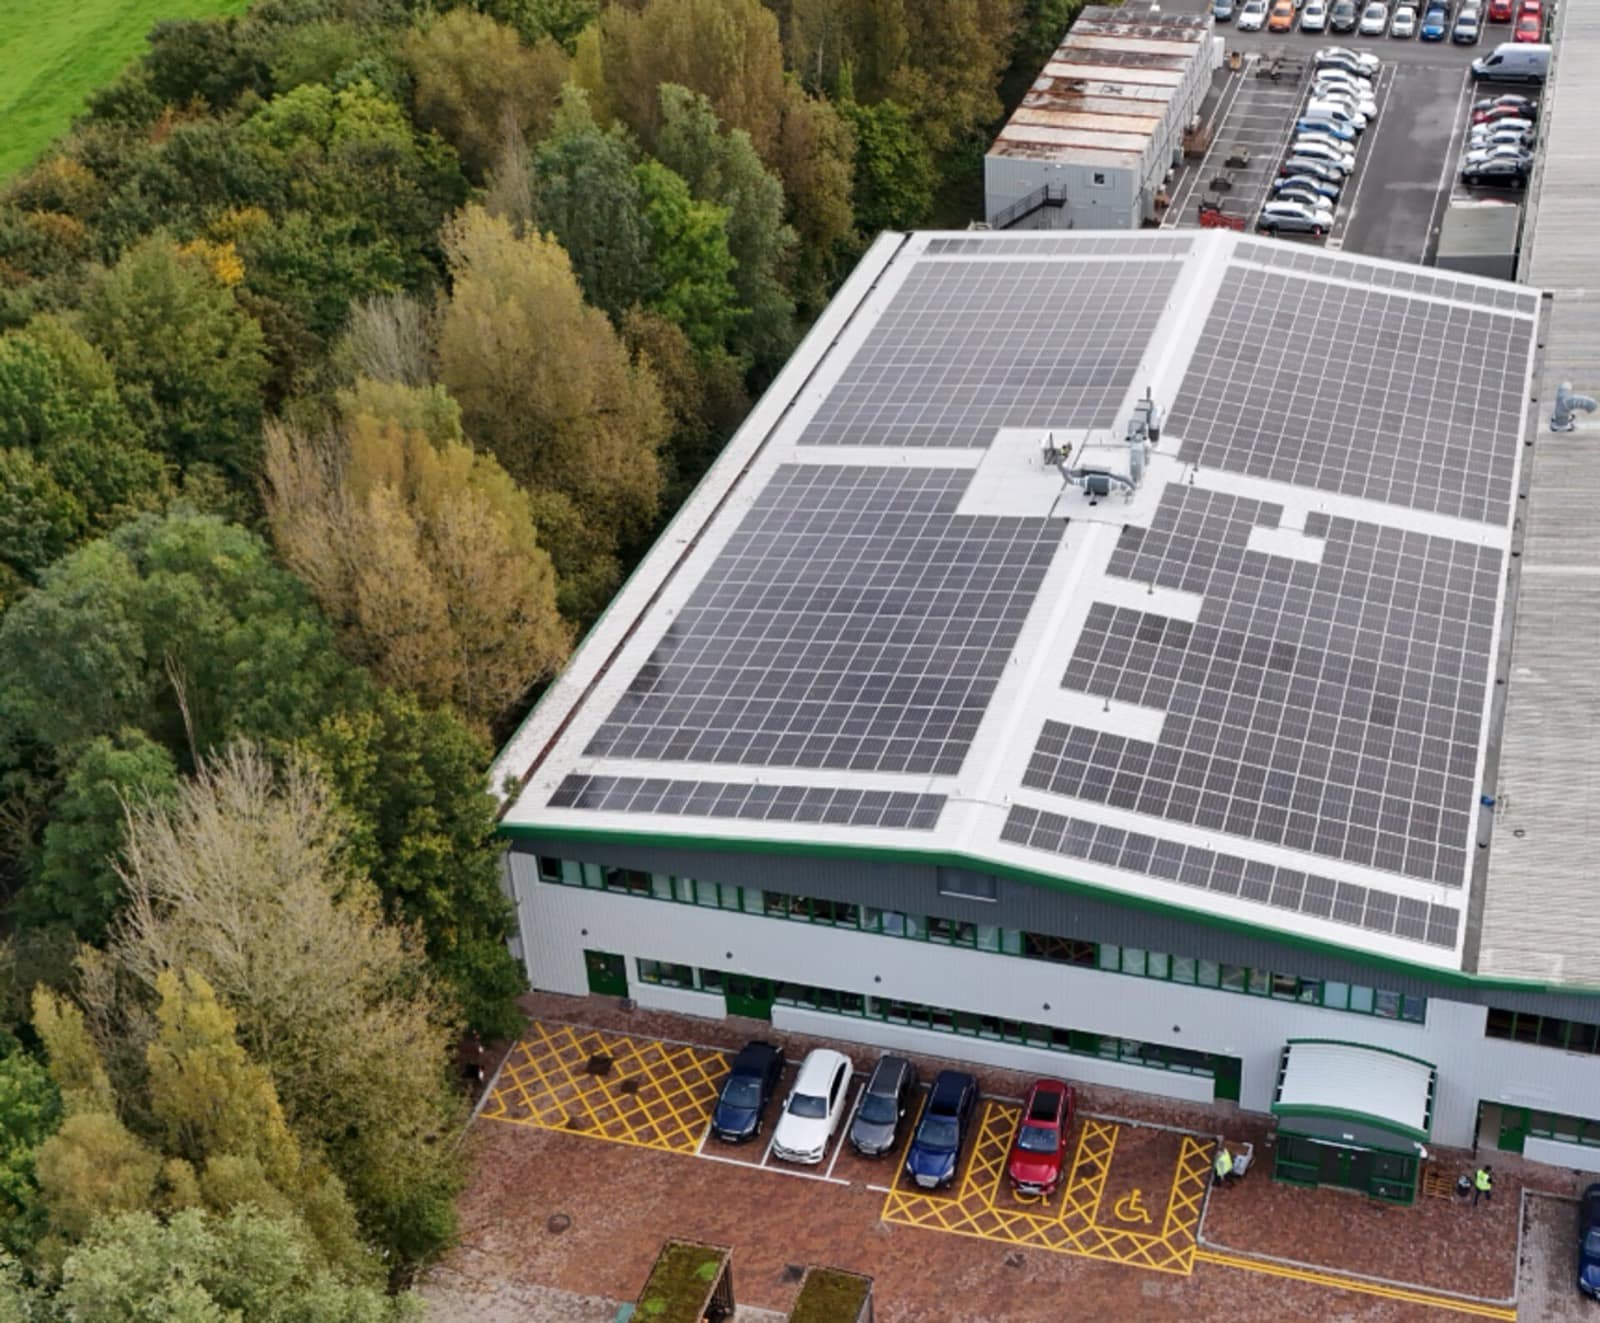
Annual usage is the wrong place to start.
Manufacturing sites are sized wrong more often than any other commercial sector, because installers default to annual usage rather than the site's real load curve. A single-shift site and a 24/7 site with the same annual kWh consumption need completely different systems.
Shift patterns
A two-shift site's demand curve doesn't match daylight generation the way a single-shift site's does; storage sizing has to close that gap, not just be added as an afterthought.
Roof loading and structural capacity
Heavy industrial roofs (and the plant already sitting on them) constrain array design before a single panel is chosen.
DNO / grid connection headroom
Expansion plans are frequently blocked by connection capacity, not by the solar decision itself.
Continuous-process loads
Machinery that can't tolerate a supply interruption changes the resilience and storage brief entirely.
The methodology — not just the claim.
- 01
Half-hourly load audit
Twelve months of half-hourly consumption data mapped against your actual shift pattern, not an annual total, to build your site's real demand curve.
- 02
Demand-curve vs generation-curve gap analysis
Overlaying that demand curve against solar generation potential to find exactly where storage needs to close the gap.
- 03
Grid capacity assessment first, not last
Checking DNO headroom against current demand and any planned expansion or electrification up front — before system design, not after.
- 04
Integrated design and phased delivery
Solar, storage, EV and grid designed as one system, sequenced around shift patterns and maintenance windows.
Problem, solution, outcome.
- 1 · Problem
Edwards Vacuum operates energy-intensive, continuous processes reliant on uninterrupted electricity supply. Rising costs were creating a growing operational burden alongside the business's own sustainability objectives.
- 2 · Solution
Nuvolt assessed the site's half-hourly consumption profile and engineered a 512 kWp rooftop PV system sized to operational demand — not roof area — integrated with the site's existing building services infrastructure.
- 3 · Outcome
£71,177 in year-one savings on a roughly five-year payback. 263.62 MWh generated on site. Approximately 50.98 tonnes of CO₂ saved annually.
We've done this before.
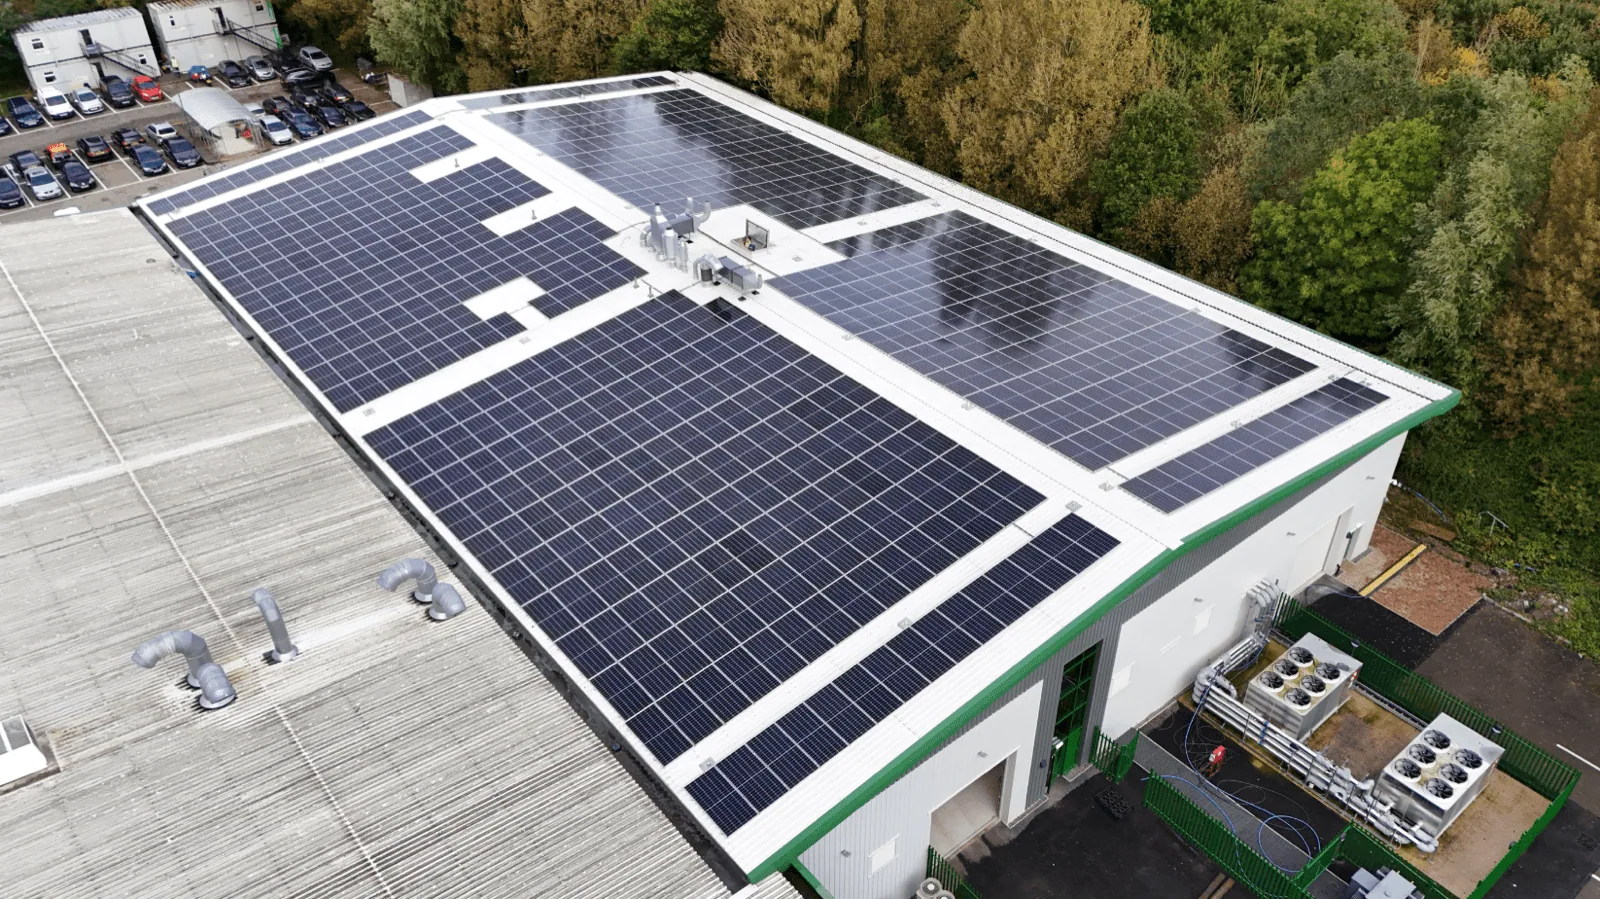
512 kWp rooftop solar woven into a live, high-specification industrial manufacturing site.
The commercial upside, in plain terms.
Generate at a fraction of grid cost
On-site solar offsets a 25–30p/kWh grid unit rate with power generated for a fraction of it.
Flatten peak demand charges
Storage shaves the expensive peaks, not just baseload — where much of the bill actually sits.
Expand without waiting on a new grid connection
The constraint 34% of industrial sites hit — addressed with generation and storage behind the meter.
Protect margin from price volatility
A fixed, self-generated cost in place of a moving wholesale rate you can't forecast.
Audit-grade Scope 2 reduction
Emissions reporting against verifiable metering that survives finance and audit review.
One accountable partner, whole-life
Strategy, engineering, funding and operation under one contract — not three suppliers pointing at each other.
Benefit statements are illustrative of Nuvolt's engineering approach. Project-specific figures are modelled against your own site data; sector statistics are drawn from the third-party sources cited on this page.
How we deliver it, end to end.
One accountable partner across the whole engagement — from the first load audit to lifetime operation.
A line for every role that has to sign this off.
Finance Director / CFO
A funding structure that fits how the business already accounts for capital — CapEx, asset finance, or fully funded — and a payback case built on the site's real consumption data.
Operations Director
Installation planned around your shift pattern and maintenance windows, engineered by the same team accountable for it once it's live.
Sustainability Lead
Scope 2 reduction reported against verifiable metering, built to survive a finance and audit review.
Managing Director
One accountable partner across strategy, engineering, funding and operation — replacing three separate suppliers who don't take responsibility for how their parts interact.
Suited to this sector.
Funding gets equal weight to engineering. The right structure follows the business, not the other way round.
Balance-sheet-strong manufacturers optimising a 25-year return typically favour CapEx ownership. Manufacturers wanting the P&L benefit without the upfront outlay favour asset finance. Where energy is a material cost line but the business would rather avoid a funding conversation, Energy-as-a-Service is Nuvolt's most-referenced route into manufacturing.
The objections we hear most.
The questions every manufacturing team puts to us before a first conversation — answered straight.
Still have a question? Talk to us
System sizing for a manufacturing site is driven by half-hourly consumption data, roof structural capacity and shift-pattern demand — not by roof area alone.
Ranges are illustrative of Nuvolt's engineering approach and must not be read as a quote, estimate or guarantee. Every site is sized against its own data.
- 1Single-shift sites: generation typically sized to cover a smaller share of daytime baseload, with export or storage handling the surplus.
- 2Multi-shift and 24/7 sites: storage plays a larger role in closing the gap between the generation curve and the demand curve.
- 3Grid connection headroom should be assessed alongside — not after — solar and storage sizing, particularly where expansion or electrification is planned.

A short conversation. No quote, no pitch — a commercial view of where your manufacturing site's energy position actually sits.
Request a half-hourly load review. We'll map your site's real demand curve against generation potential and grid headroom — no quote, no pitch, a genuine read on where your energy position sits before any system size gets discussed.
- 1Share 12 months of half-hourly data — or we'll help you request it from your supplier.
- 2We map your real demand curve against generation potential and DNO grid headroom.
- 3You get a commercial read on your energy position — before any system size is discussed.
Let's have a strategic conversation about your energy position.
An assessment, a benchmark, a roadmap — whichever is most useful. A short conversation with engineers who run commercial energy every day, not a sales call.