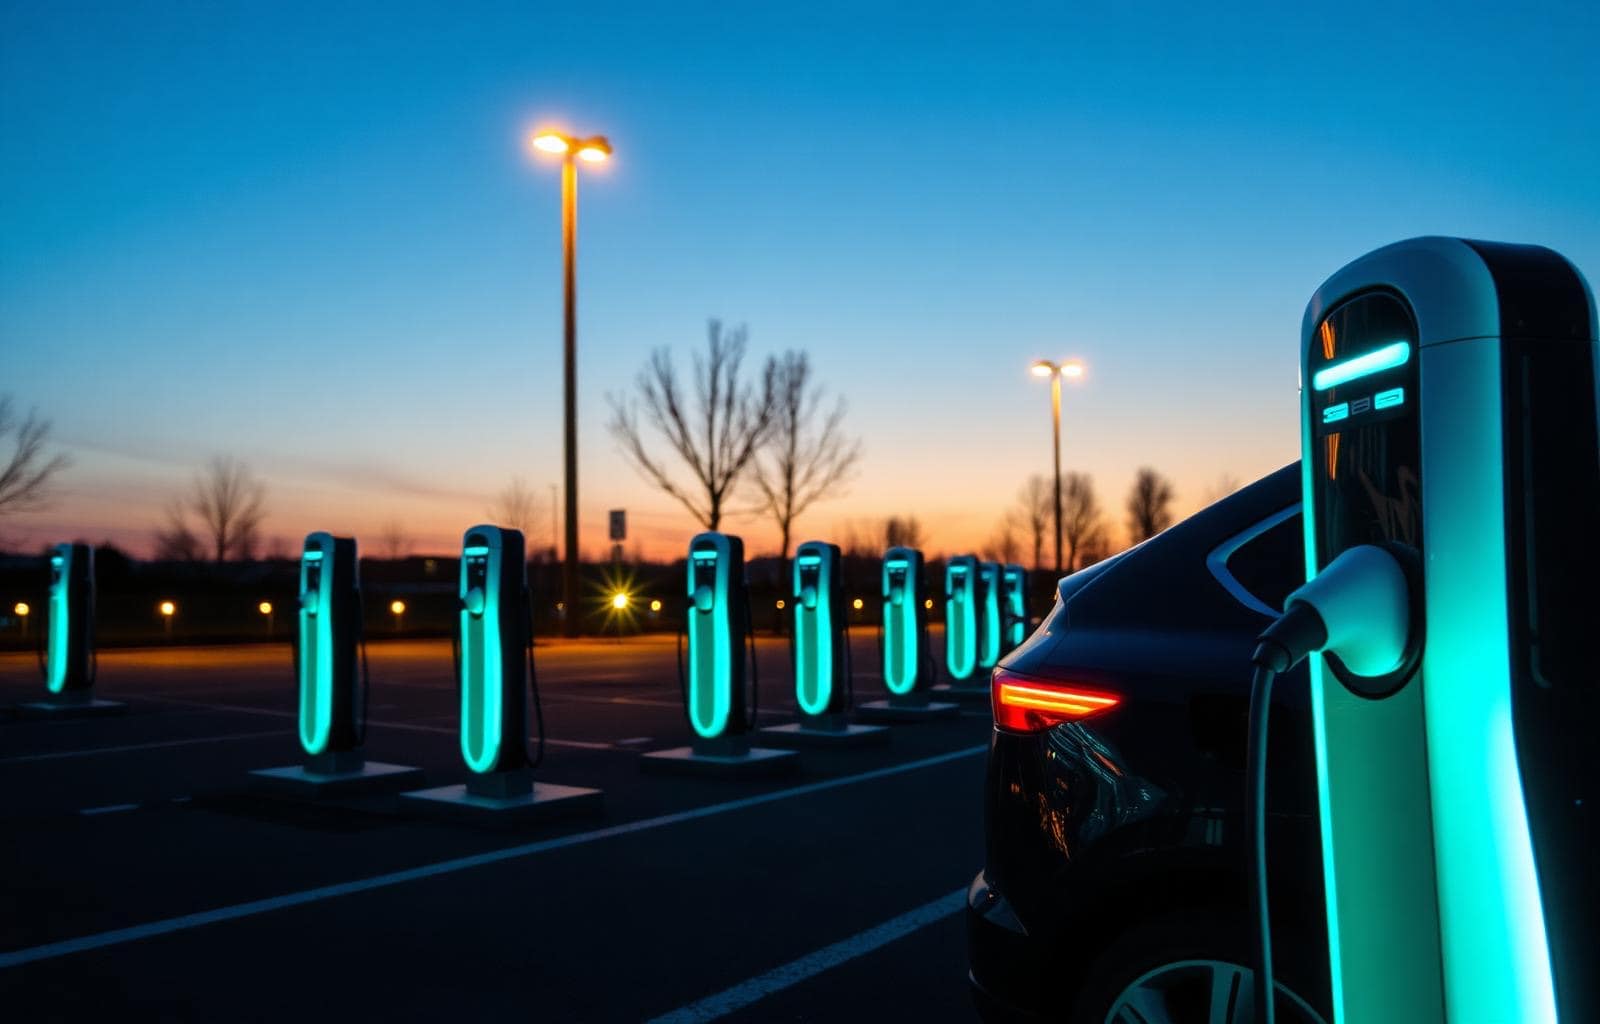
Commercial EV charging — designed for the duty cycle, not the spec sheet.
Fleet, workplace and visitor charging engineered around dwell time, grid capacity and integrated on-site generation.
Commercial EV charging fails when it's specified by socket count instead of by duty cycle. The right design starts with how long vehicles dwell, what they need topped up, and what grid capacity is actually available. Get those three right and you avoid the most common (and most expensive) outcomes: tripped feeders, abandoned chargers and a DNO upgrade bill larger than the installation.
What Commercial EV Charging actually is
On-site electric vehicle charging infrastructure — AC (7–22 kW) for dwell-time charging or DC (25–350 kW) for rapid top-up — designed around the duty cycle of the vehicles using it and the available grid capacity at the site.
A retail commodity. The same '22 kW dual socket' deployed at a logistics hub and a hotel car park will fail differently. The hardware is the easy bit; the design is everything.
- AC charging
- Slower (7–22 kW), uses the vehicle's onboard charger. Best for long dwell times: workplace, hotel, overnight fleet.
- DC rapid charging
- 50–350 kW, bypasses the onboard charger. Best for short dwell times: forecourt, in-route top-up.
- Dwell time
- How long a vehicle is parked at the charger. Drives the AC vs DC decision and the per-bay power rating.
- DNO connection
- Permission and physical capacity from the regional Distribution Network Operator. Often the rate-limiting step for any rollout above ~100 kW.
- Load management
- Smart software that dynamically allocates available grid capacity across multiple chargers to prevent overload.
- OZEV
- Office for Zero Emission Vehicles — administers the Workplace Charging Scheme grant (£350 per socket, up to 40 sockets per site).
How it works
Six checkpoints from data to commissioning. Scroll to step through each one.
- Step 01
Duty cycle and dwell-time analysis
We audit the vehicles — fleet, staff, visitors — and how long each dwells. A 14-hour overnight fleet needs different infrastructure to a 2-hour visitor car park, even at the same socket count.
- Step 02
Grid capacity assessment
MPAN headroom check, DNO consultation, and any required G99 application. We find out what's available before specifying what's installed — not after.
- Step 03
Load management layer
Dynamic load balancing redistributes available capacity across active chargers. Often allows 30–50% more sockets within the same grid headroom.
- Step 04
Civils, installation and commissioning
Cable runs, foundations, bollards, signage, weatherproofing — sequenced around live operations. Commissioning includes back-office integration and tariff setup.
- Step 05
Operation, billing and SLAs
Ongoing maintenance, uptime guarantees and back-office billing (staff, fleet, visitor). OCPP-compliant hardware keeps you portable between operators.
Commercial impact
EV charging is rarely a savings story — it's an enablement story. The commercial case is built on fleet transition cost, staff retention, lease incentives, visitor draw and (sometimes) revenue from public charging. Treating it as a cost-saving project sets the wrong KPI.
- 01
OZEV Workplace Charging Scheme provides £350 per socket (up to 40 sockets per site) — directly reducing capital cost.
- 02
Salary-sacrifice EV schemes for staff make on-site charging a retention and recruitment tool, not just a perk.
- 03
Fleet transition from diesel to electric saves £2,000–£5,000 per vehicle per year in fuel and maintenance — charging infrastructure is the enabler.
Operational impact
Charging hardware is reliable; charging deployments fail operationally for two reasons: insufficient grid capacity (chargers throttle or trip) and poor user experience (chargers locked, broken or out of service for weeks). Both are designable problems.
- 01
Dwell-time modelling typically shows AC 7–22 kW is right for 80%+ of commercial use cases — DC rapid is over-specified more often than under-specified.
- 02
Load management lets you install more sockets within existing grid headroom — often the difference between a 6-month project and a 2-year DNO upgrade.
- 03
OCPP-compliant hardware avoids vendor lock-in; back-office operator is replaceable.
Risks — and how we de-risk them
Early DNO engagement; load management to fit within available capacity; phased rollout aligned to DNO upgrade timeline.
Dwell-time analysis before hardware selection. AC handles long-dwell use cases at a fraction of the cost and grid load.
OCPP-compliant hardware specified by default. Back-office operator can be switched without changing the chargers.
Utilisation forecast modelled before commitment. Load management allows over-allocation of sockets where utilisation is uneven.
Proactive monitoring, 24-hour response SLA, and clearly contracted maintenance from day one.
Applications submitted and locked in before commercial commitment. Project economics modelled with and without grant.
How it gets paid for
Four ways to fund the same physical asset. Pick the one that matches your balance sheet and your time horizon.
One site, four charger duty cycles
Most failed EV projects use one charger spec for everything. Tap a zone to see what each duty cycle actually needs.
7–22 kW AC — staff dwell 6–9h, low simultaneity factor
How this stacks up against the alternatives
AC vs DC is not a hardware question — it's a duty-cycle question.
| AC 7–22 kW | DC 50–150 kW | DC ultra-rapid 150–350 kW | |
|---|---|---|---|
| Best dwell time | 3+ hours | 30–60 min | 10–20 min |
| Typical use case | Workplace, hotel, overnight fleet | Visitor / mid-stay | Forecourt / in-route |
| Cost per bay (installed) | £1k–£3k | £20k–£50k | £75k–£150k |
| Grid load per bay | Low | Medium | High |
| DNO upgrade likely? | Often no | Sometimes | Almost always |
| OZEV-eligible | Yes (sockets) | Limited | No |
EV charging is the easiest part of any energy transition to get wrong — and the most visible. The right design starts before any hardware is chosen, ends with users who can rely on it, and quietly accommodates the next five years of fleet growth without another disruptive project.
Questions buyers actually ask
Selected projects
Marston's PLC
Sustainability initiative — headquarters and Phase 1 solar installation across Marston's hospitality estate, delivered with HT Power PPA support.
- System size
- 114.38 kWp
- CO₂ saved
- 17.44 T
- Payback
- 4 years
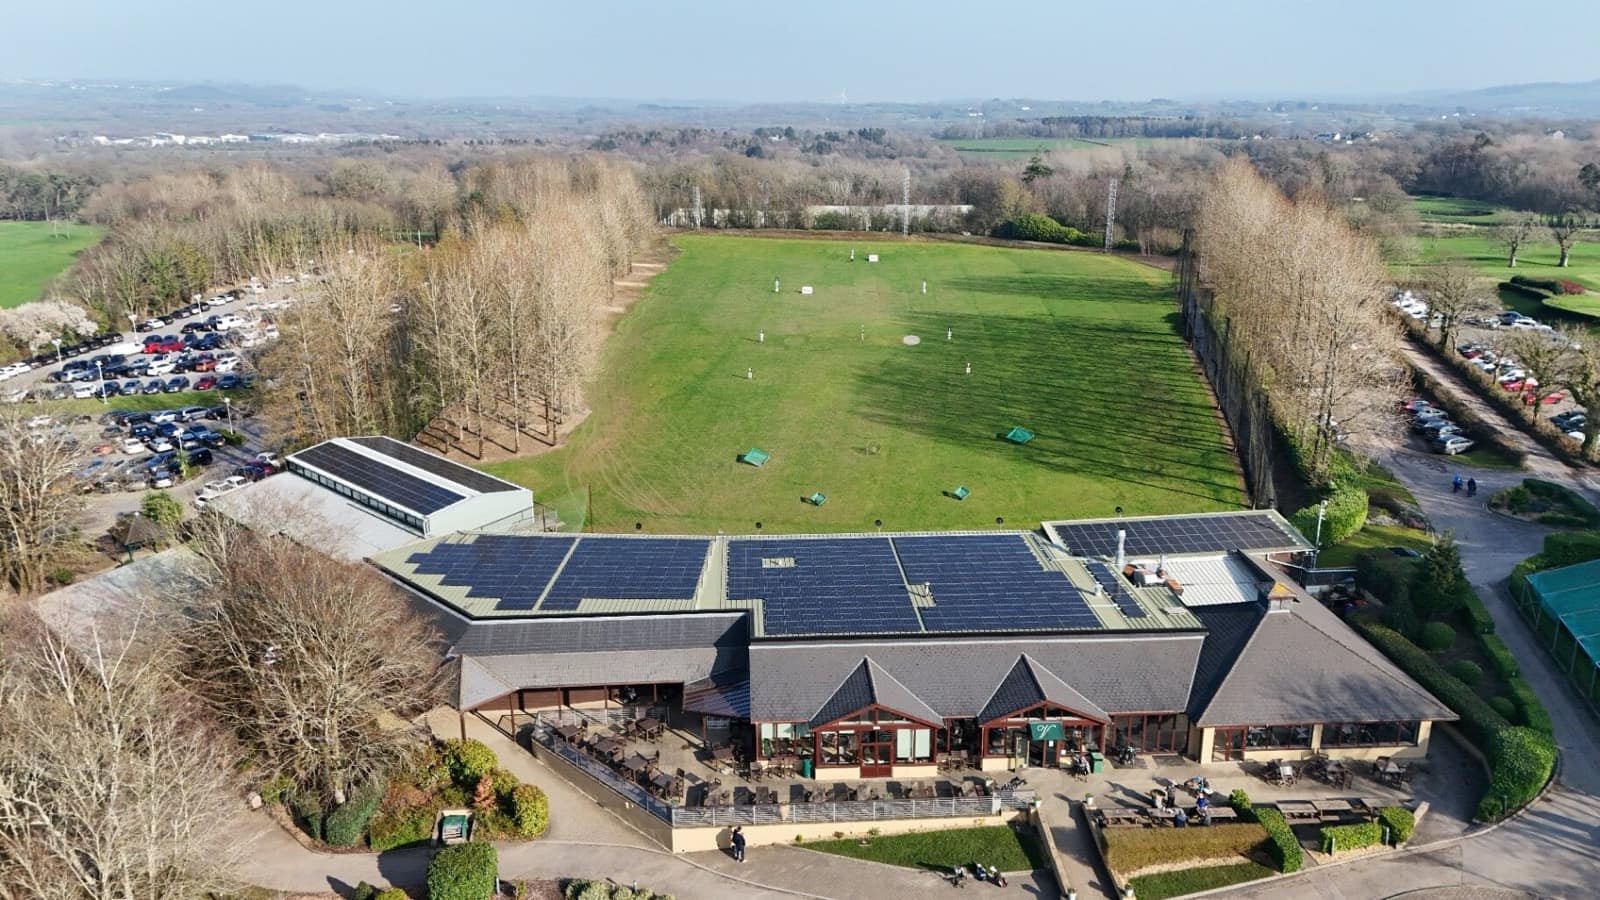
The Vale Resort
Solar PV plus EV charging delivered live across a working luxury resort and golf club.
- System size
- 168.81 kWp
- Year-1 savings
- £43,049.60
- CO₂ saved
- 28.8 T
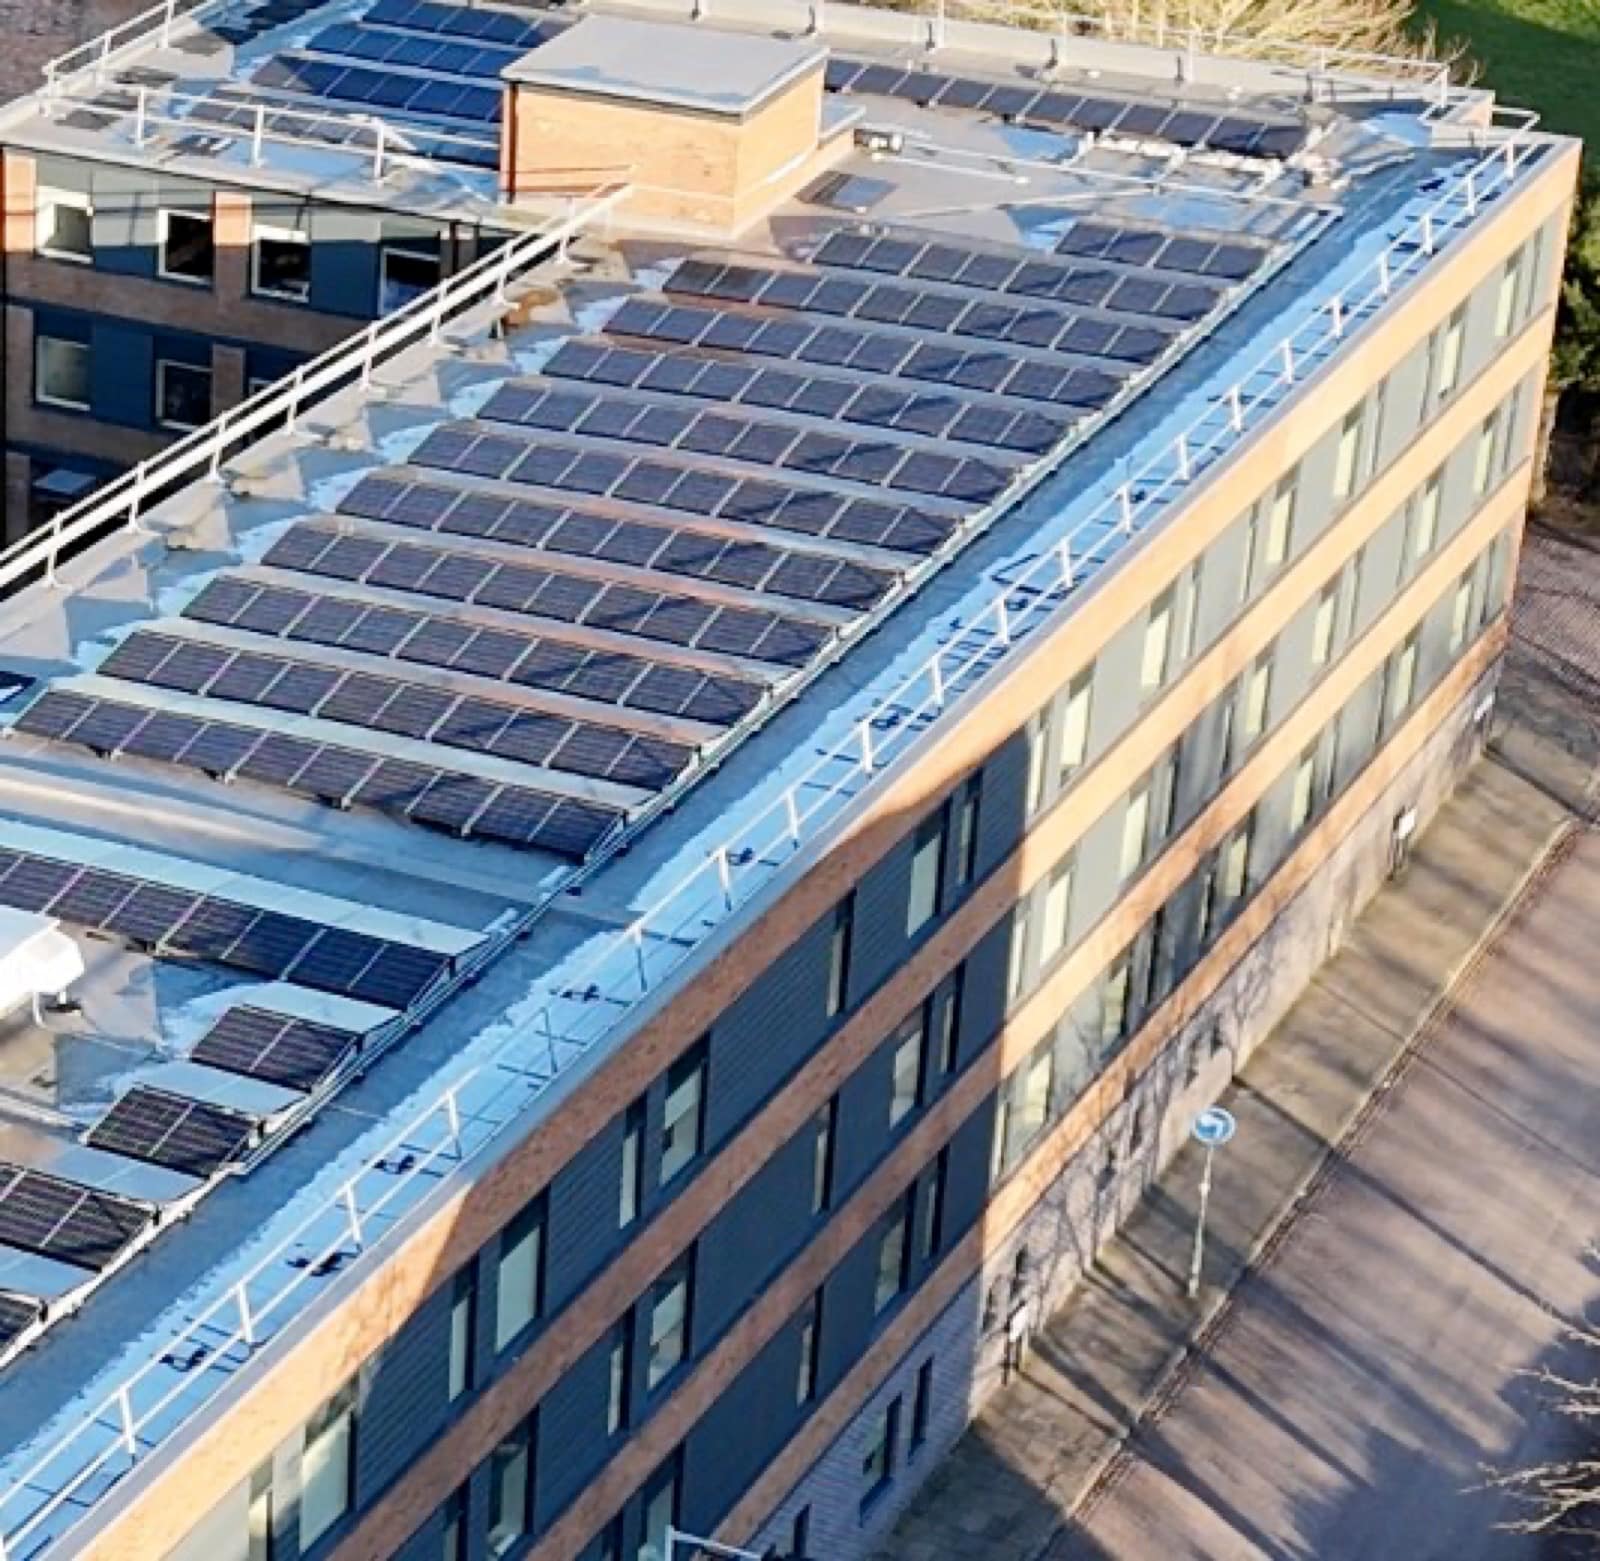
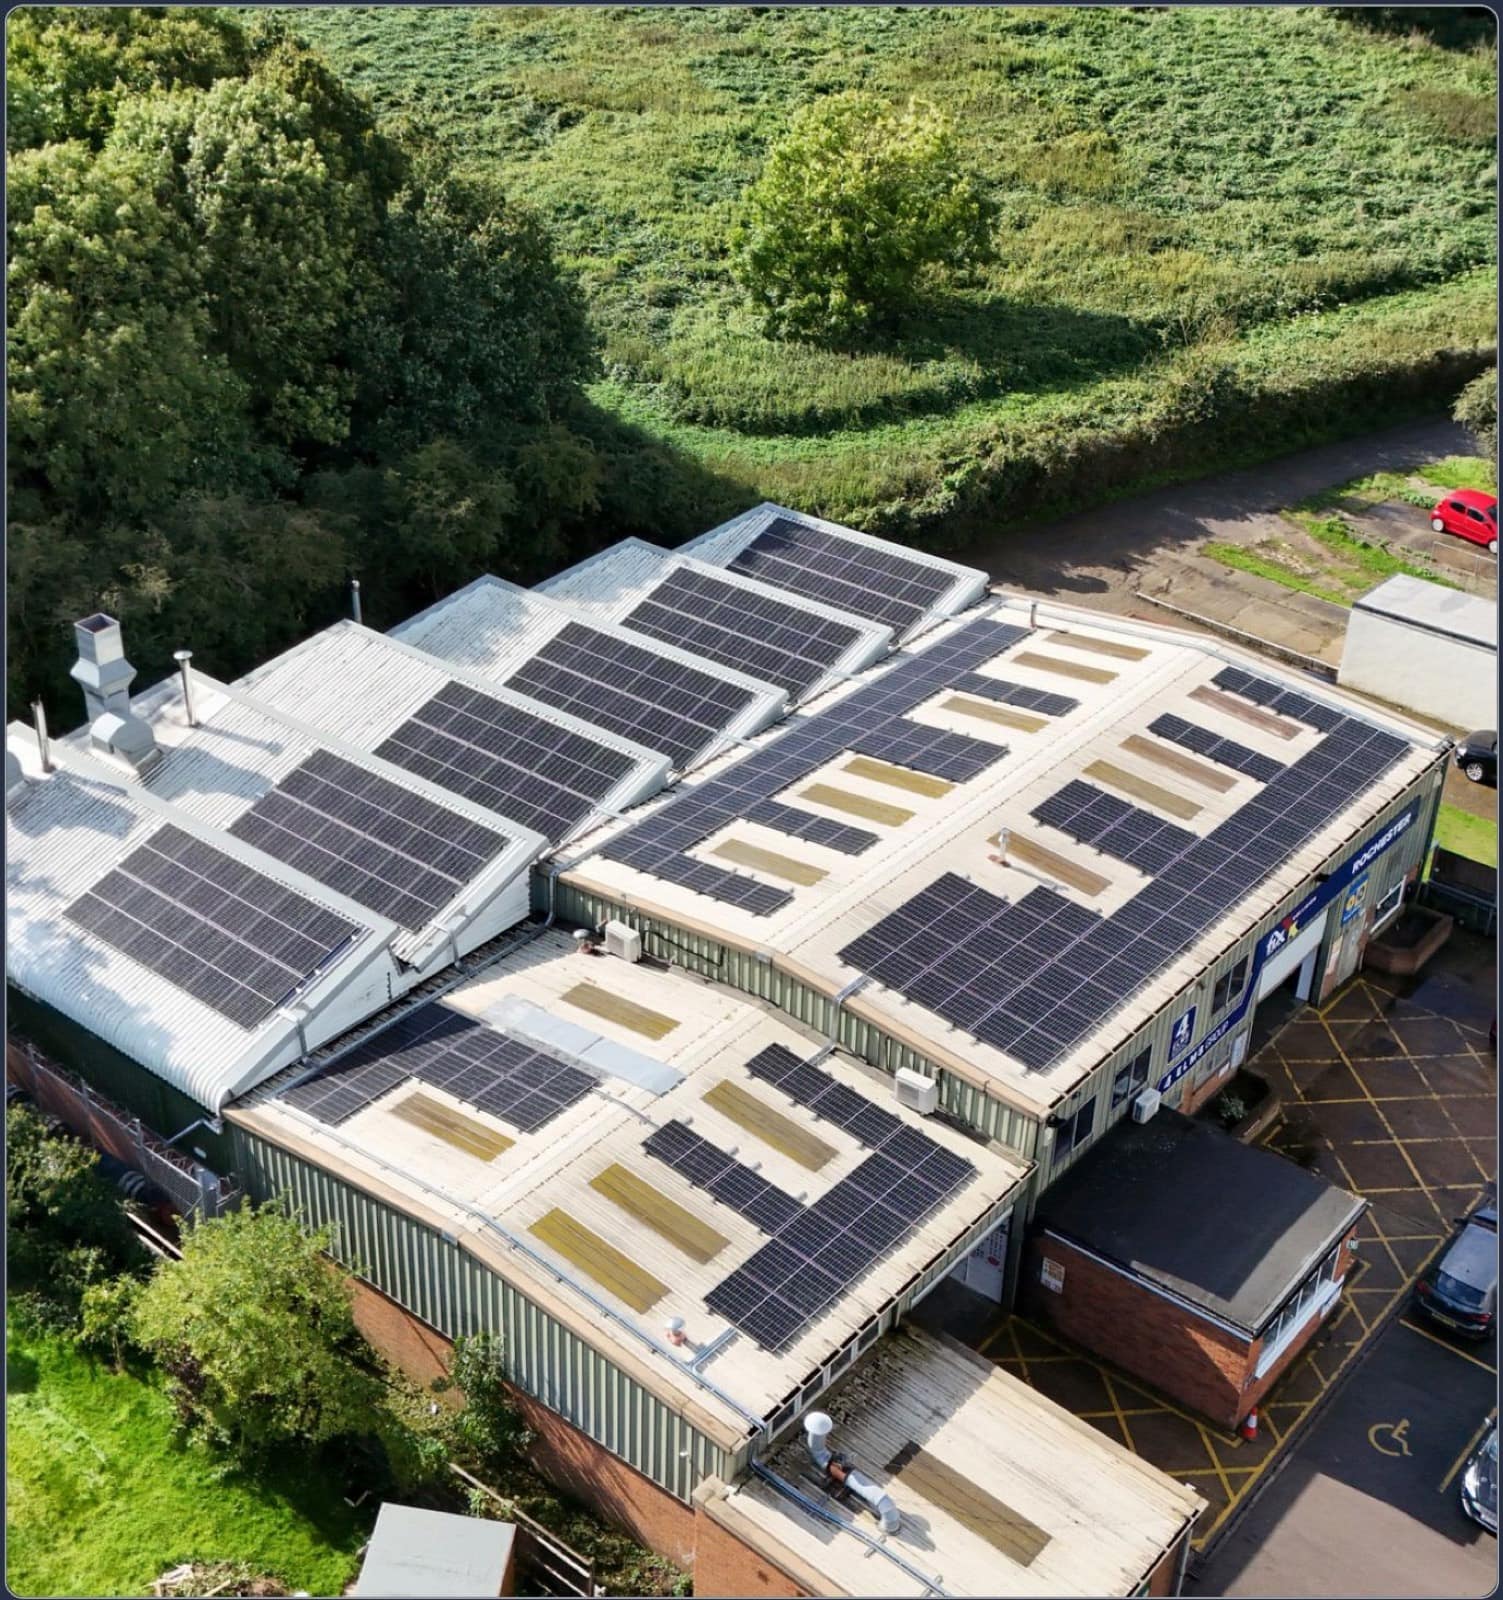
Four Elms Group
Solar PV across a UK network of automotive repair and accident management centres.
- System size
- 117.45 kWp
- Year-1 savings
- £33,632
- Payback
- 3 years
Related solutions

Commercial Solar PV
Bespoke rooftop and ground-mount solar designed to cut your bills and your scope-2 emissions.
Battery Storage
Pair storage with solar — or run it standalone — to optimise tariffs, resilience and grid revenue.

Energy-as-a-Service
We design, build, fund and operate your energy assets. You pay a fixed unit rate and start saving from day one.
Ready to model your numbers?
Five quick questions and our team will come back with a tailored proposal — CAPEX, finance, PPA or fully funded.