Solar O&M — why most systems underperform after year 3.
A practical guide to operations, maintenance and monitoring for commercial solar — and why the asset you paid for in year 1 is rarely the asset you still own in year 5 without it.
Most commercial solar systems quietly lose 5–20% of their expected output by year 3–5 — not from module degradation (which is gradual and predictable) but from string faults, inverter failures, soiling, shading changes and monitoring blind spots that nobody notices. Proactive O&M with string-level monitoring, response SLAs and annual performance benchmarking typically recovers that lost yield and pays for itself many times over.
What O&M & Performance actually is
Operations & Maintenance — the discipline of monitoring, inspecting, maintaining and responding to faults across a commercial solar PV asset, with the goal of protecting long-term yield and the original financial business case.
A reactive 'call us when it breaks' service. By the time a solar fault is visible to a building manager, the system has usually lost output for months. Effective O&M is proactive and data-driven, not reactive.
- String-level monitoring
- Per-string current and voltage measurement, allowing faults to be isolated to specific groups of panels rather than detected as a whole-system underperformance.
- Performance Ratio (PR)
- Actual output divided by theoretical maximum output for the array, given irradiance and temperature. A healthy commercial array runs at PR 0.78–0.85.
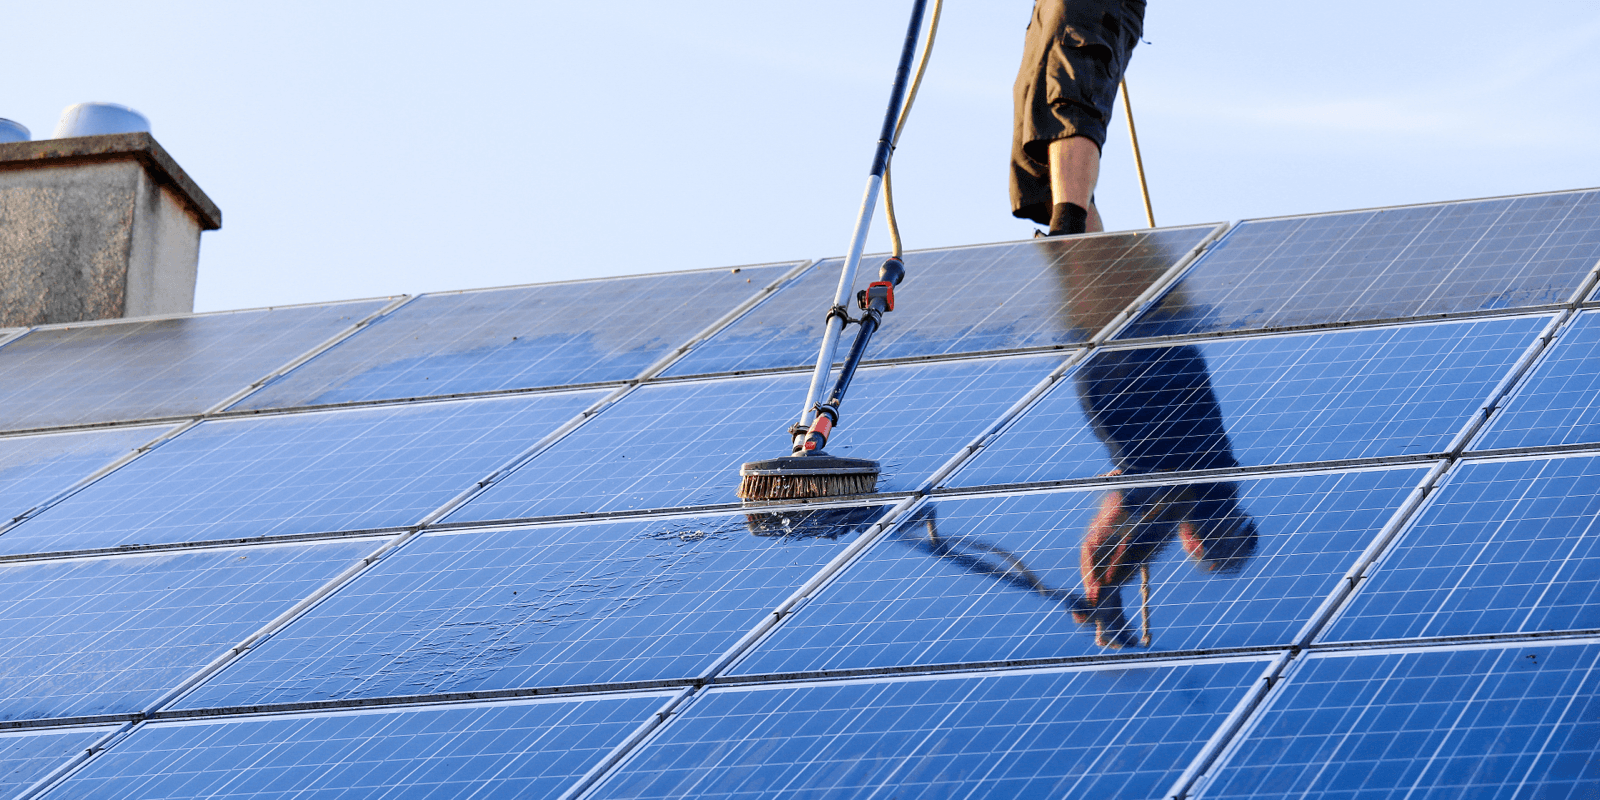
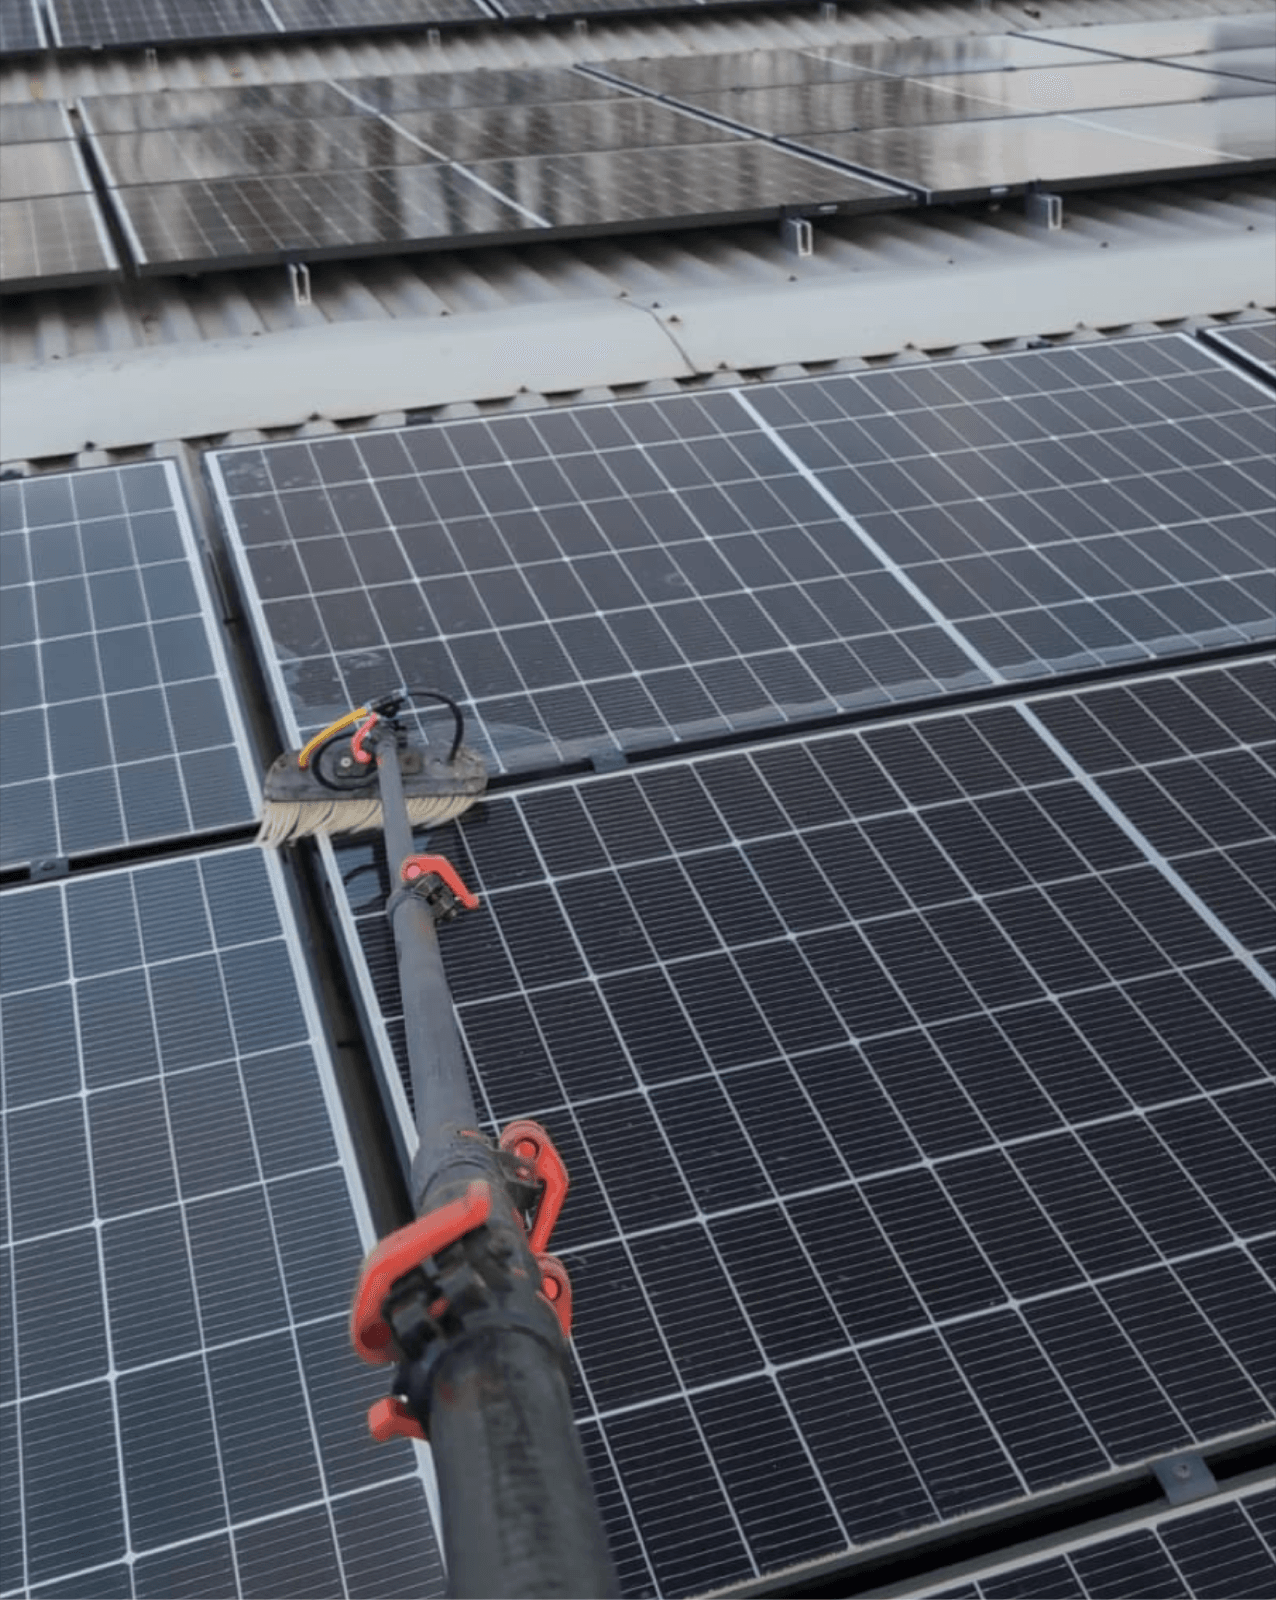
- Soiling
- Dust, bird droppings, pollen and organic debris on panel surfaces. UK natural rainfall handles most soiling; localised soiling (under bird perches, exhausts) does not self-clear.
- MTBF
- Mean Time Between Failures. Inverters typically have MTBF of 10–15 years — most commercial systems will see one inverter replacement during their life.
- Response SLA
- Contracted response time from fault notification to engineer on site. Typical commercial SLAs: 24 hours for major faults, 5 working days for minor.
- Performance guarantee
- Contractual commitment to a minimum yield or PR. Shortfalls trigger compensation, aligning O&M provider incentives with asset performance.
How it works
Six checkpoints from data to commissioning. Scroll to step through each one.
- Step 01
Live string-level monitoring
Every string instrumented; alarms trigger automatically when output deviates from expected. Faults isolated to specific strings within minutes, not discovered at annual review.
- Step 02
Annual performance benchmarking
Actual yield benchmarked against design, accounting for irradiance, temperature and availability. Variance triggers investigation — not 'normal weather' shrug.
- Step 03
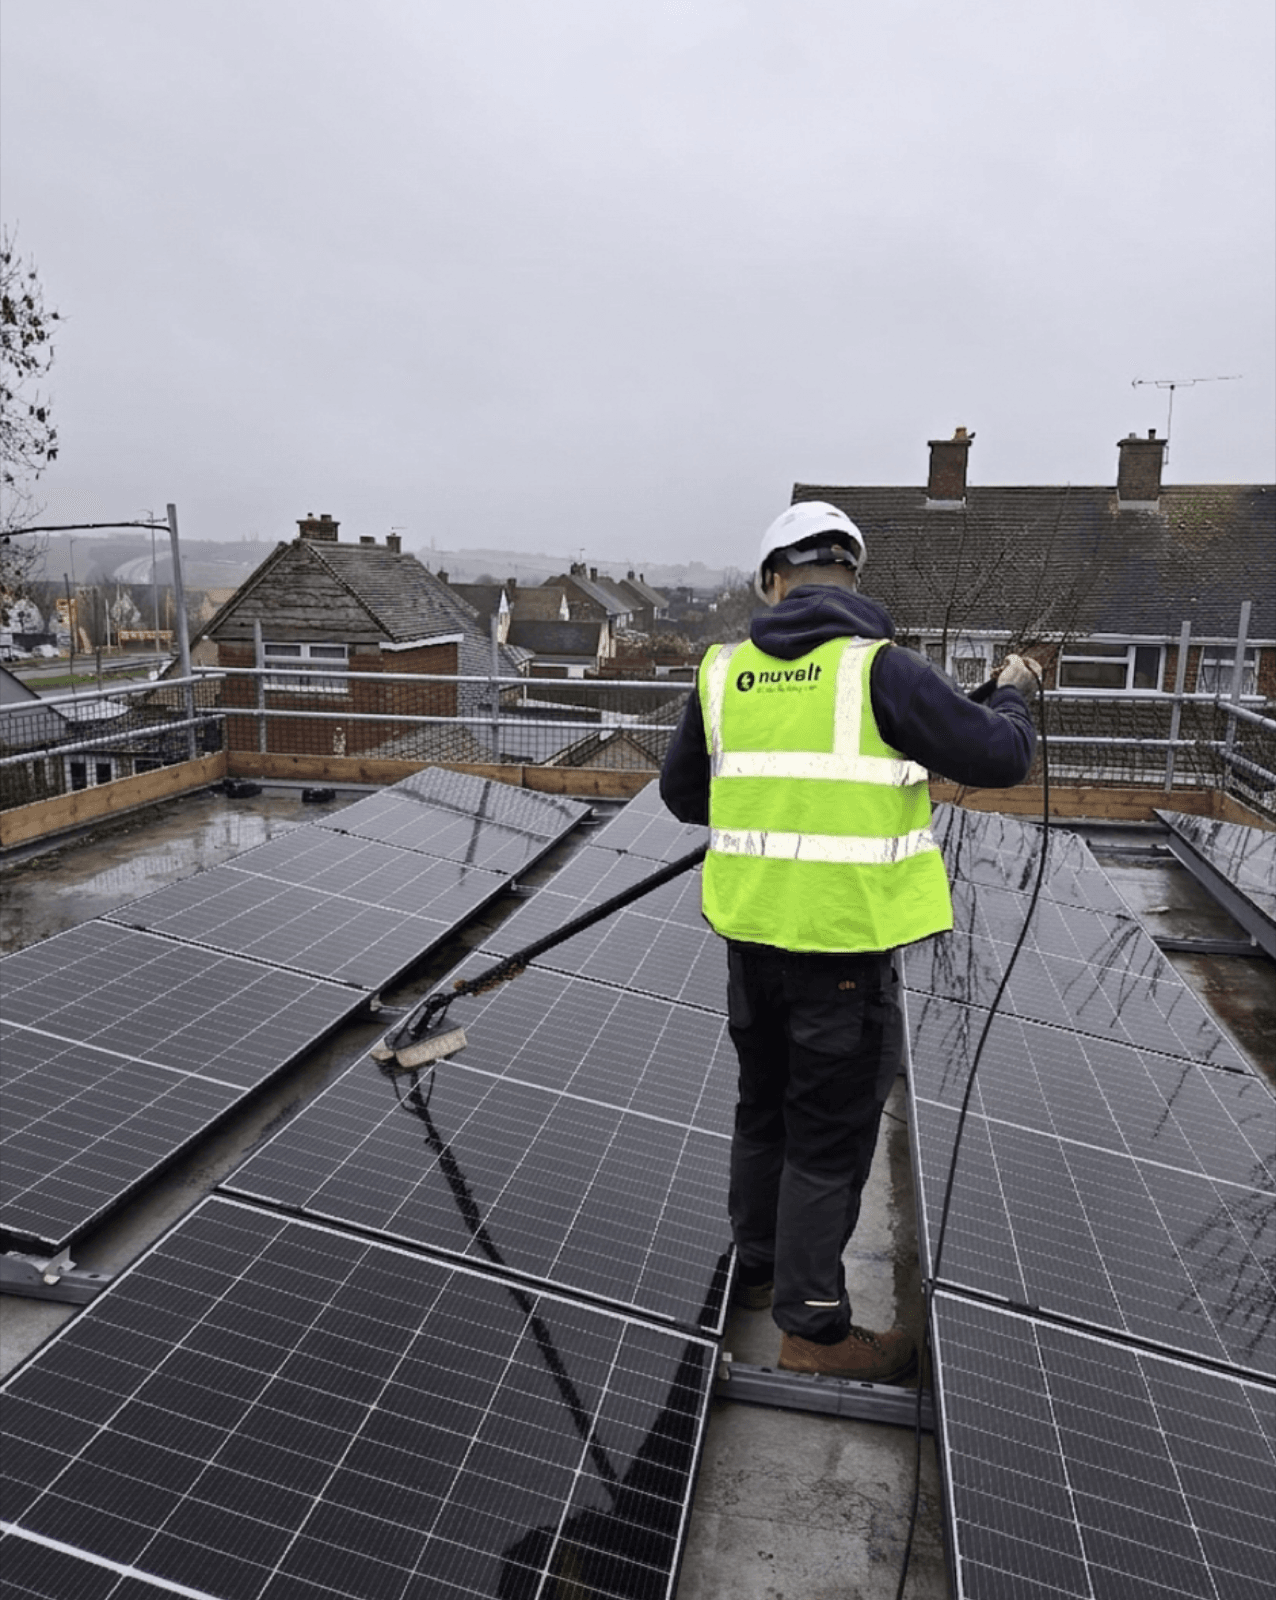
Scheduled inspection and preventative maintenance
Annual visual inspection, electrical safety checks, fixings and cable management review, inverter firmware updates, thermographic survey on schedule.
- Step 04
Reactive response under SLA
Defined response times for major and minor faults. Engineer on site within contracted window, not 'when we can fit you in'.
- Step 05
Lifecycle planning
Inverter replacement windows, panel cleaning where economically justified, monitoring hardware refresh, end-of-life planning — all forecast and scheduled rather than reactive.
Commercial impact
O&M economics are the inverse of the typical capital-equipment trade-off. Spending a small annual sum on monitoring and response protects an asset generating ~£10,000–£100,000 of value per year. Skipping it is almost always the most expensive decision in the asset's life.
- 01
Typical O&M cost for commercial solar: ~1–2% of system value per year. Yield protected: 5–20% of annual generation across the asset's life.
- 02
A single undetected inverter fault on a 200 kWp system costs ~£500–£2,000 per month in lost generation — payback on monitoring measured in weeks.
- 03
Performance guarantees from O&M providers transfer yield risk away from the asset owner.
Operational impact
Good O&M is invisible when it works. The operational deliverables are clear: assets that perform to design, faults caught before they become outages, documented inspection records, and a single point of contact for anything that goes wrong.
- 01
24/7 monitoring with automated alarming — faults logged before the building manager would notice.
- 02
Annual visual and electrical inspection, with documented reports retained for the asset's life.
- 03
Thermographic inspection on schedule — catches hot-spotting and cell-level defects invisible to eye and to monitoring.
Risks — and how we de-risk them
String-level monitoring with automated alarms. Underperformance isolated to a specific string within hours, not discovered in annual reporting.
Spares relationships and pre-agreed replacement windows. Typical replacement 5–10 working days vs 4–6 weeks without an O&M contract.
Annual visual inspection identifies localised soiling (bird perches, exhausts, drainage paths). Cleaning targeted where it's economically justified.
Annual site survey identifies new shading; mitigation includes vegetation management or string reconfiguration where shading is structural.
Documented as-built records, monitoring system access and component data ensure any qualified O&M provider can take on the asset.
Full inspection, fault and remediation history retained for the asset's life — directly usable in warranty and insurance claims.
How it gets paid for
Four ways to fund the same physical asset. Pick the one that matches your balance sheet and your time horizon.
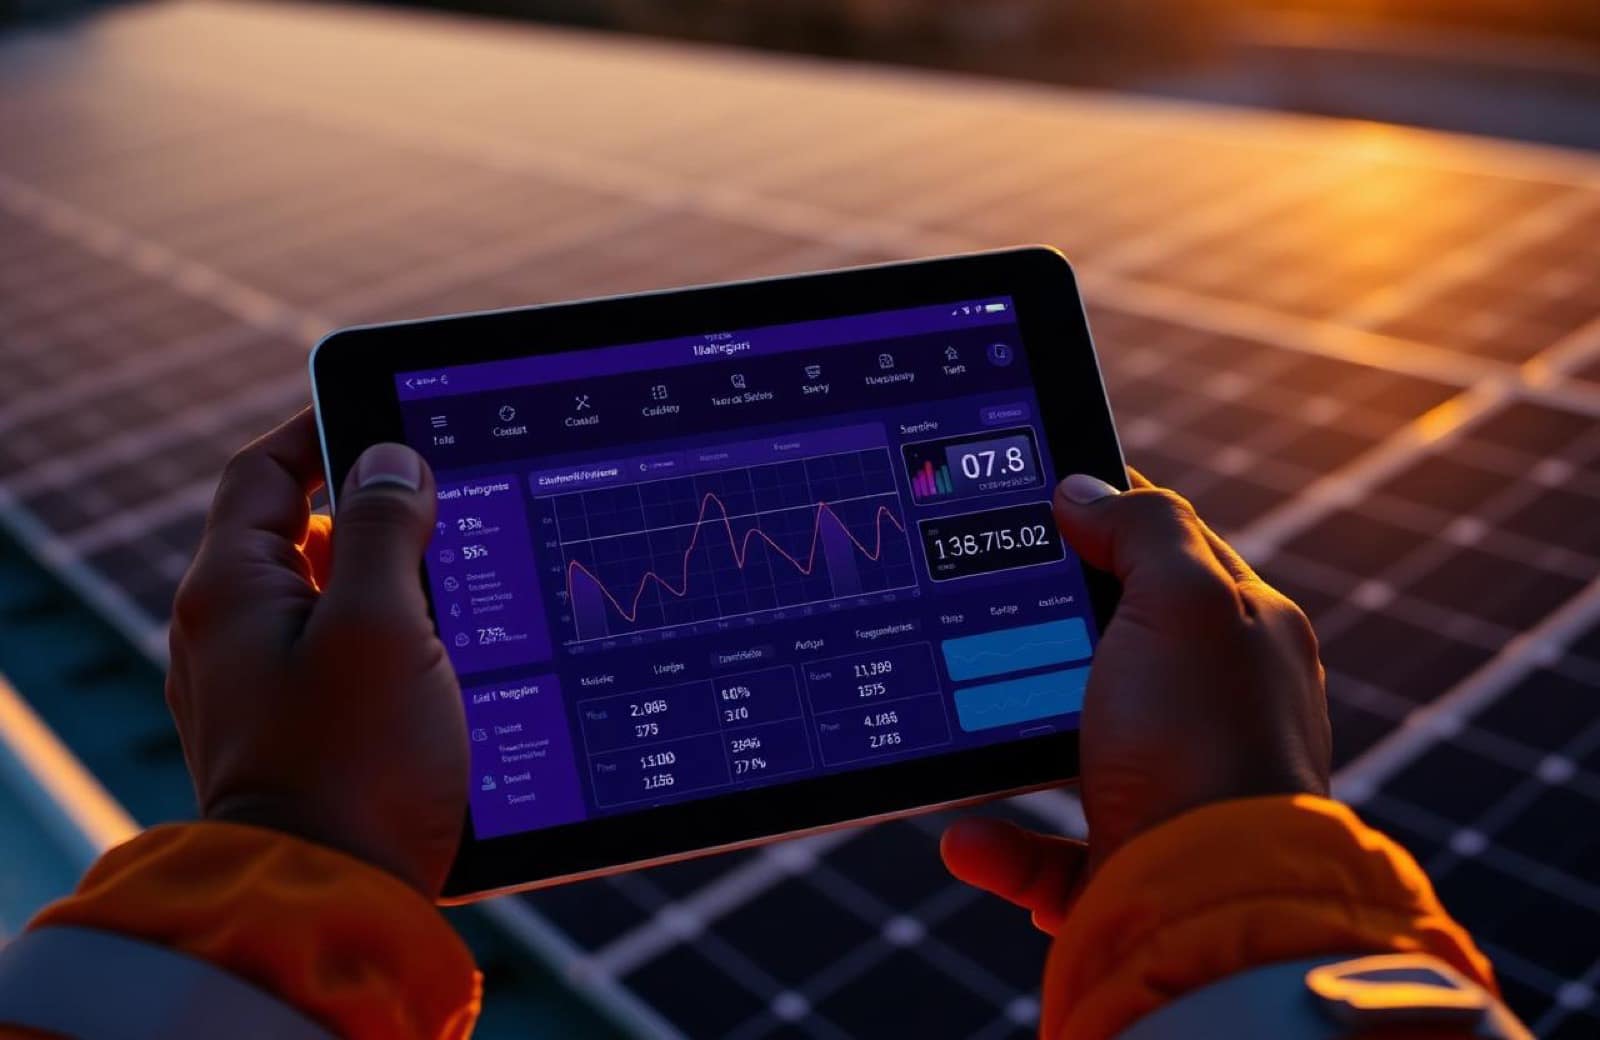
What good monitoring actually looks like
String-level visibility, automated alerting, performance versus design — the difference between a healthy 25-year asset and a slow drift to 80%.
How this stacks up against the alternatives
| Proactive O&M | Annual visit only | Reactive (pay-per-call) | No O&M | |
|---|---|---|---|---|
| Monitoring | String-level, live | None | None | None |
| Fault detection time | Hours | Up to 12 months | When user notices | Often never |
| Inverter replacement window | 5–10 days | Weeks | Weeks | Months |
| Performance benchmarked | Yes — annual | Sometimes | No | No |
| Annual cost | ~1–2% of system | ~0.3% of system | Variable + downtime | Zero (until failure) |
| Typical yield protected | 95–100% | 85–95% | 70–90% | 60–85% |
| Original IRR protected? | Yes | Mostly | Often no | Almost never |
The capital decision is made once, at the start. The yield decision is made every day for 25 years. O&M is what turns the modelled IRR into a real one — and what stops the asset you paid for becoming the asset you forgot about.
Questions buyers actually ask
Selected projects
Marston's PLC
Sustainability initiative — headquarters and Phase 1 solar installation across Marston's hospitality estate, delivered with HT Power PPA support.
- System size
- 114.38 kWp
- CO₂ saved
- 17.44 T
- Payback
- 4 years
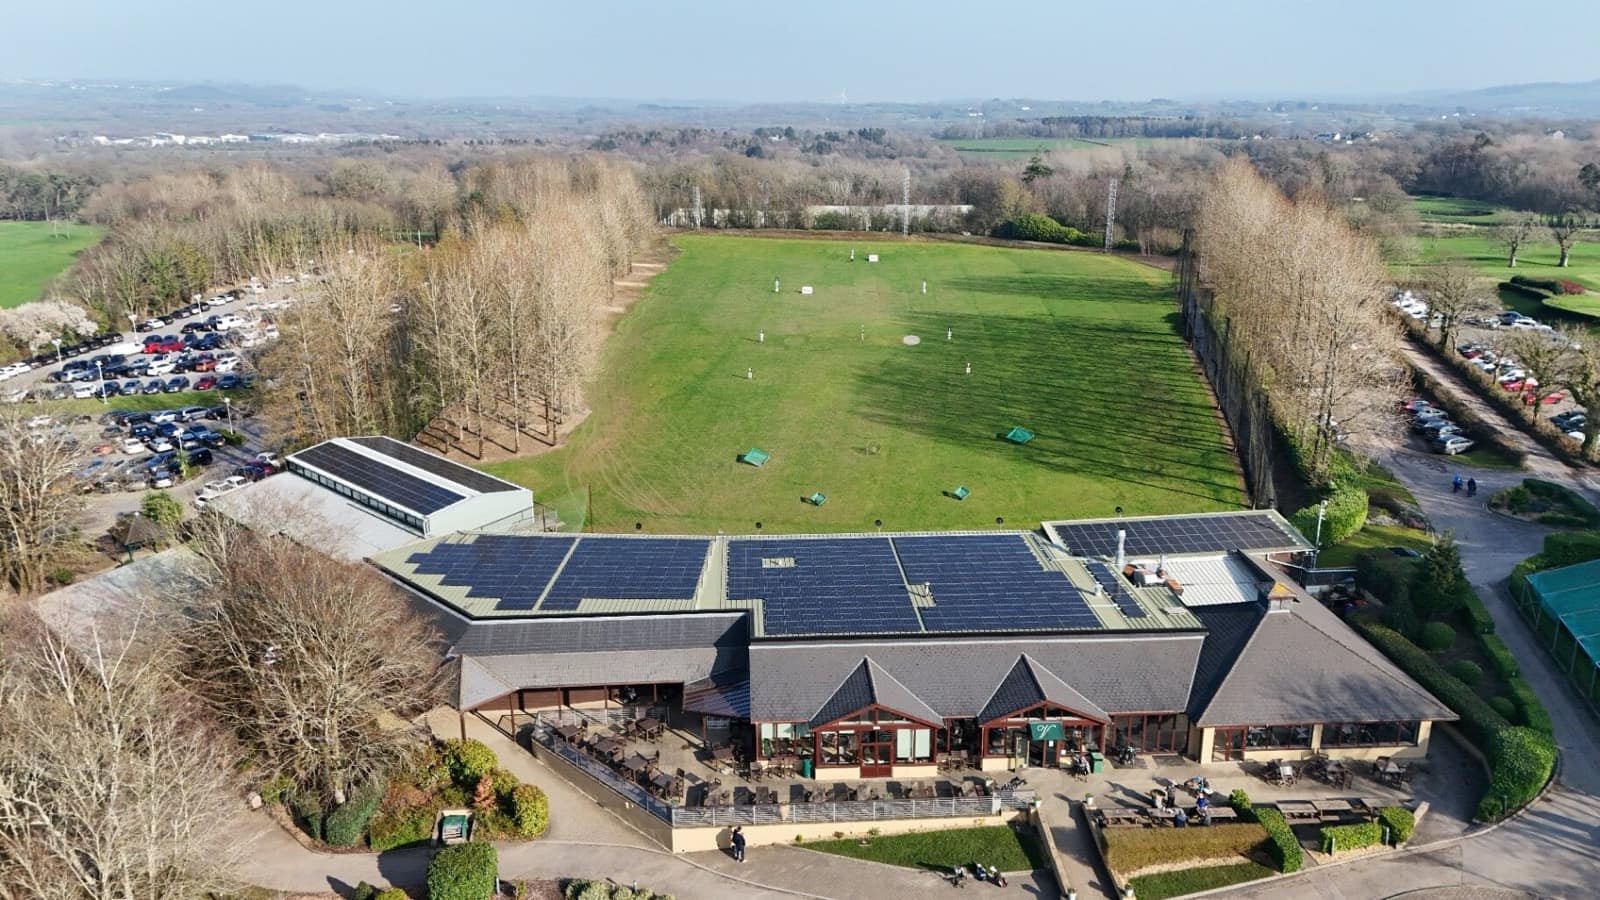
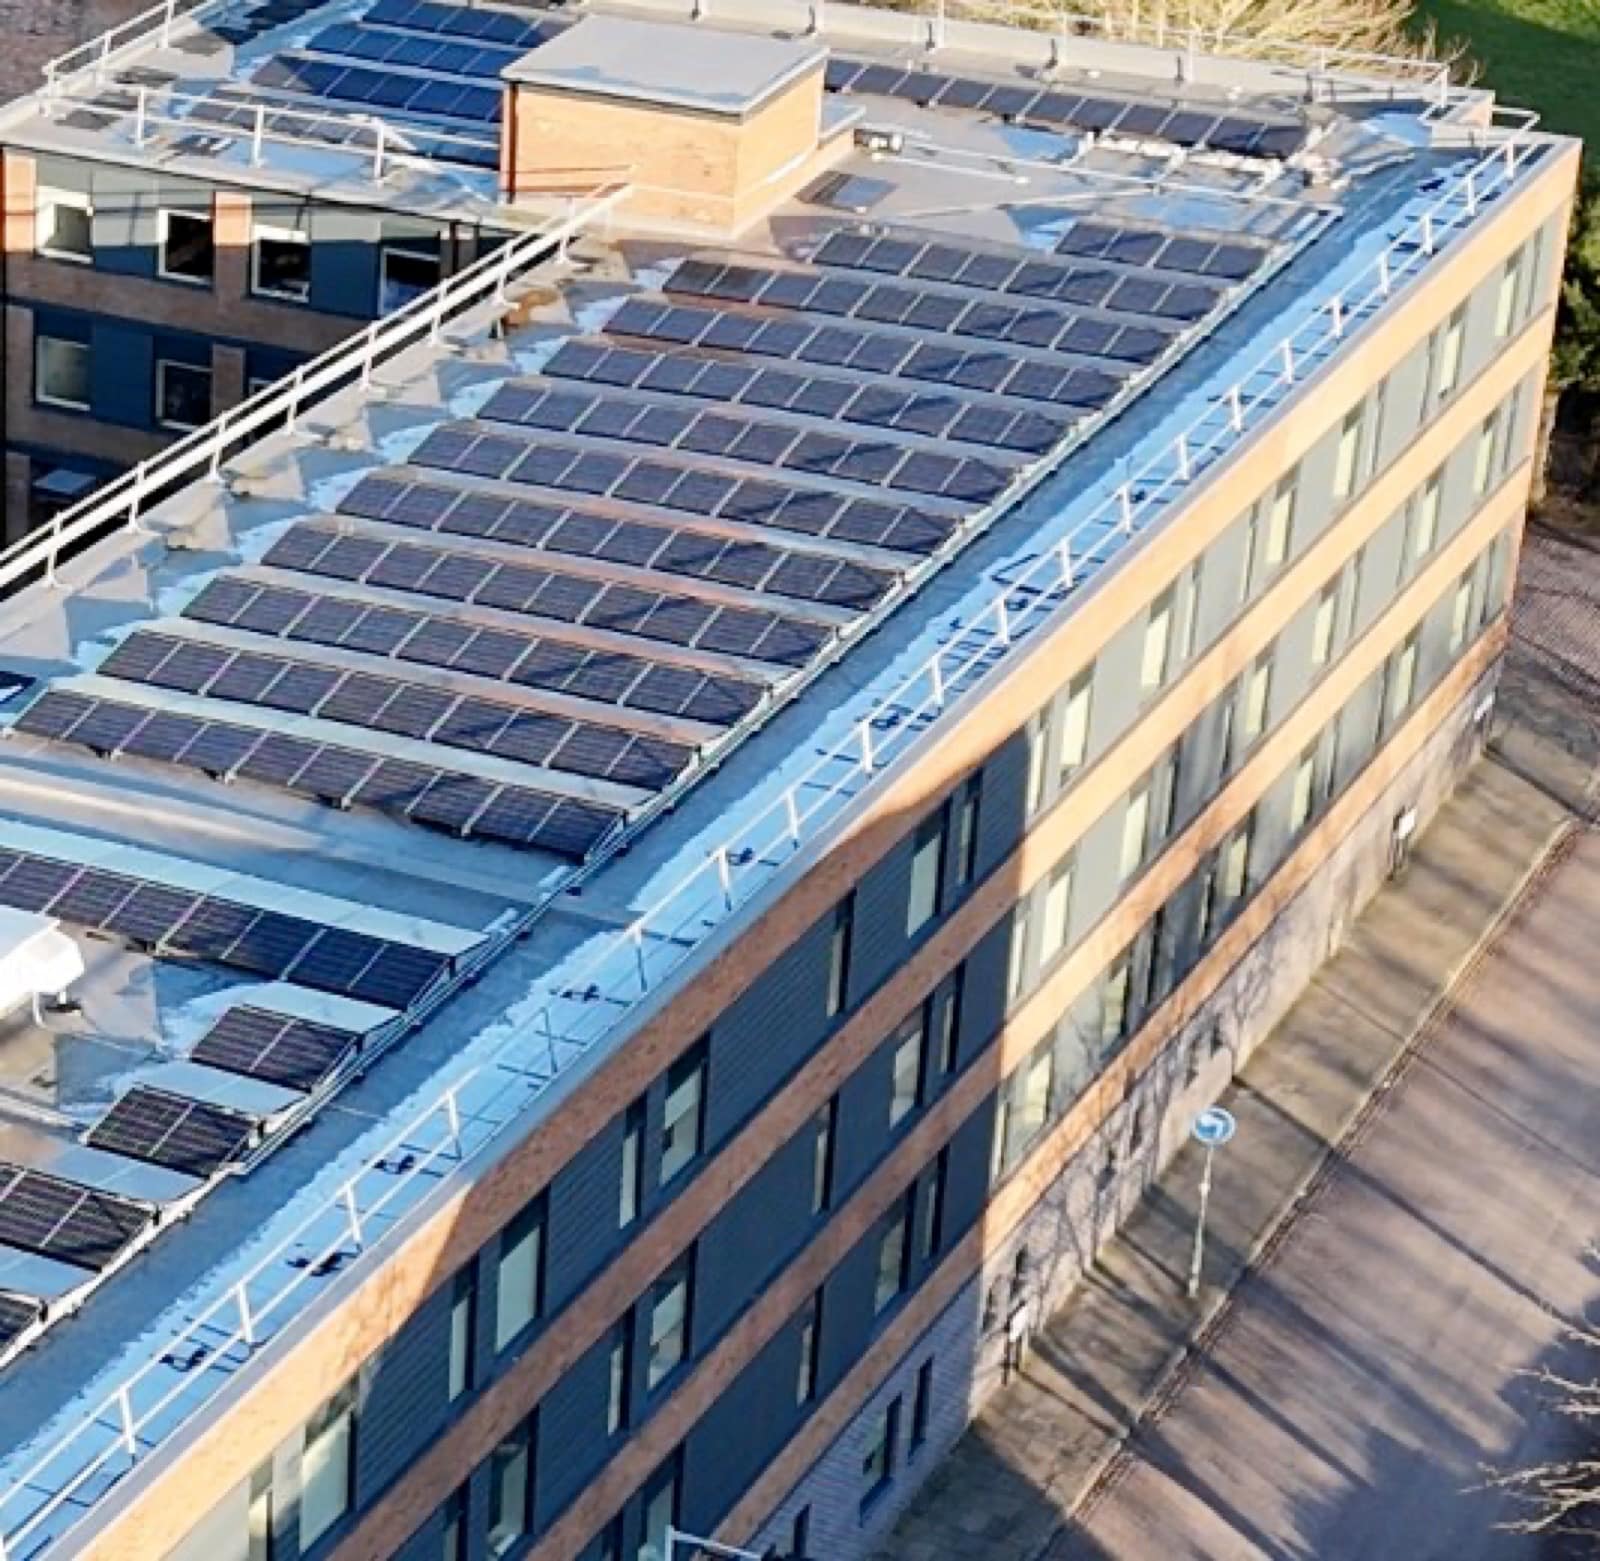
The Vale Resort
Solar PV plus EV charging delivered live across a working luxury resort and golf club.
- System size
- 168.81 kWp
- Year-1 savings
- £43,049.60
- CO₂ saved
- 28.8 T
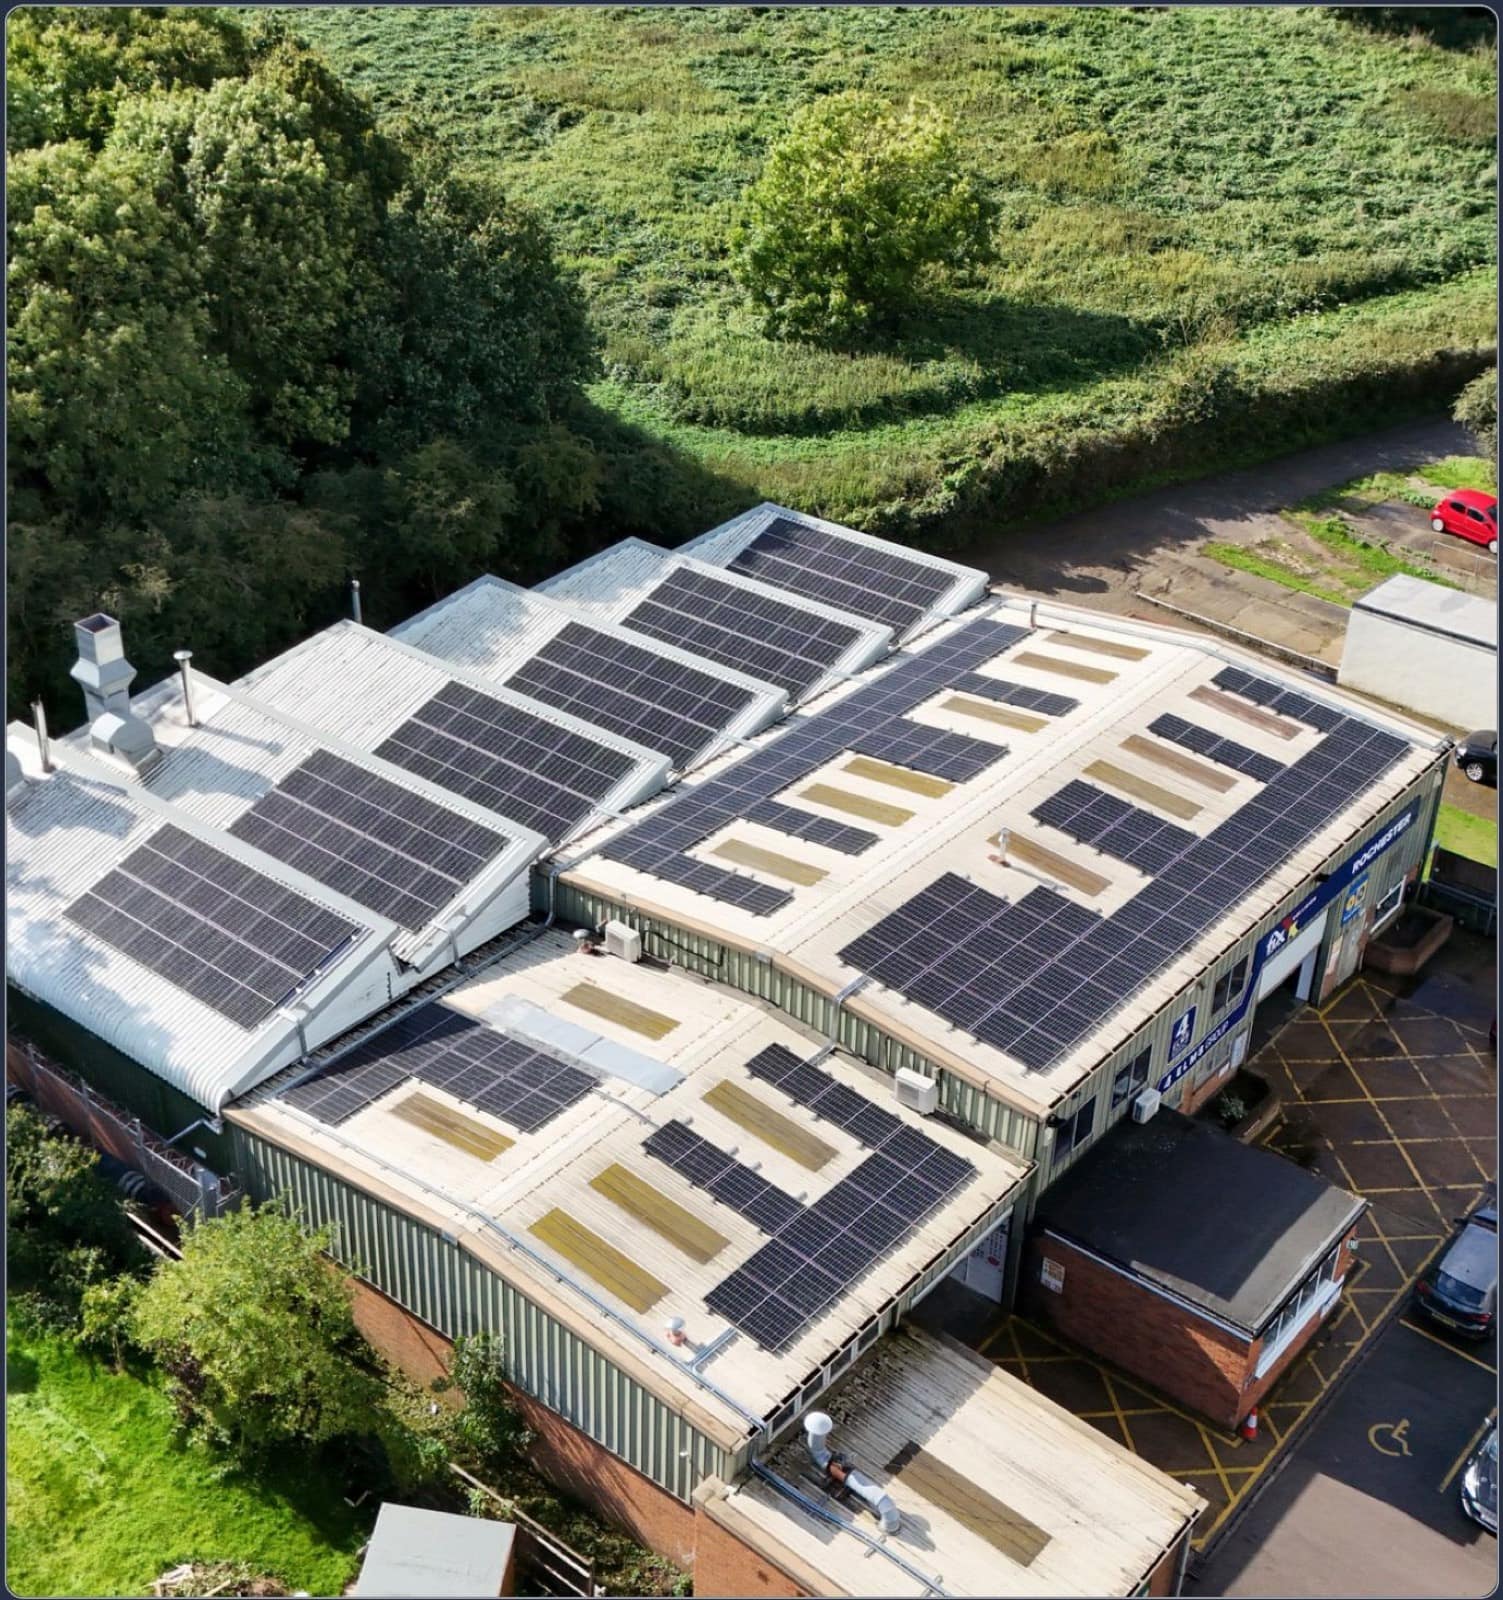
Four Elms Group
Solar PV across a UK network of automotive repair and accident management centres.
- System size
- 117.45 kWp
- Year-1 savings
- £33,632
- Payback
- 3 years
Related solutions

Commercial Solar PV
Bespoke rooftop and ground-mount solar designed to cut your bills and your scope-2 emissions.
Battery Storage
Pair storage with solar — or run it standalone — to optimise tariffs, resilience and grid revenue.

EV Charging
Full consultancy, installation and maintenance for charging at any scale, integrated with on-site generation.
Ready to model your numbers?
Five quick questions and our team will come back with a tailored proposal — CAPEX, finance, PPA or fully funded.